Decoz® Chartmaker
Use as often as you like!
Make them for yourself and your friends.
Sample Decoz®Chart

Celebrating the 40-year anniversary of the Decoz Chartmaker, 1982-2022
Use as often as you like!
Make them for yourself and your friends.
Sample Decoz®Chart
Celebrating the 40-year anniversary of the Decoz Chartmaker, 1982-2022
Download the World Numerology app. Find out if you have Master Numbers in your chart...

-Ω-
THE SYSTEM THAT CHANGED THE WAY PROFESSIONALS READ YOUR NUMBERS
There are some problems with that. It's hard to oversee the chart as a whole, to recognize the connections between a range of numbers. This is crucial during a consultation; you have to be able to see the relationships between all the numbers quickly and clearly, because all the numbers absorb and reflect energies from each other.
In the early 80's I grew into a habit of creating schematics that showed multiple numbers. Over time, they became more organized, until eventually the lay-out grew into an easy-to-oversee concise graphic showing all relevant numbers as well as twenty-five years of cycles. I made generous use of symbols to differentiate what any of them meant, and added color based on number values (1 is red, 2 is orange, etc.), for easy viewing; color-coding them, not unlike a bookkeeper or librarian might to organize their files and books.
The DecozChart uses long-established Pythagorean calculation methods. All I did was create an organized lay-out. The end result was a graphic layout I could work with without having to flip pages and look for notes, all the relevant numbers are clearly defined, which greatly improves a professional's ability to offer an insightful consultation.
Sign up and get access to our new web app (free) and use it to make three different kinds of charts: a complete chart calculator, the Decoz®Chart, and the new Proportional Chart.
-Ω-
The DecozChart may look a little intimidating, but you will get used to the layout very quicky, and it will greatly help you oversee it in a way no other charting method does.
We will use the fictitious Anthony Joseph Mercier, born October 12, 1986, and who goes by Tony Mercier.
-Ω-
The top left is used for his full name at birth, the right side for his current name.
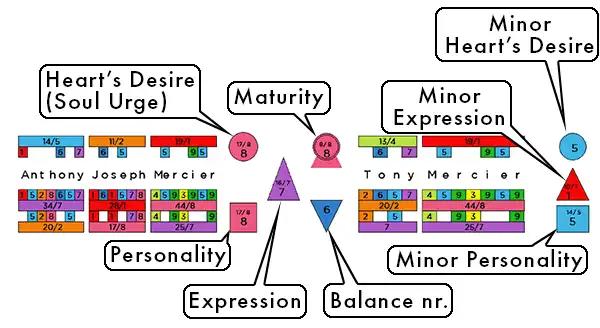
The Heart's Desire, Personality, Expression, Maturity, and Balance number are all based on the letters and their numerology values in the full name. The Minor Heart's Desire, Minor Expression, and Minor Personality are based on the current name and play a lesser, and very different role.
-Ω-
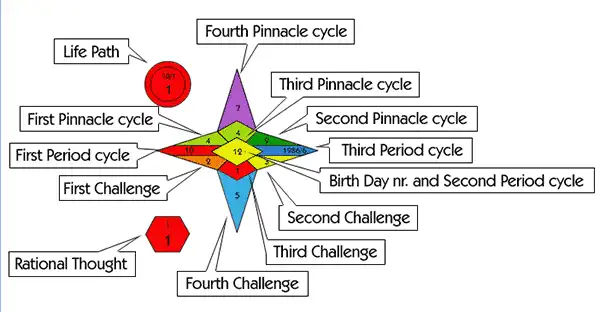
All numbers that are derived from your date of birth (shown in the center bar of the star - in Tony's case 10/12/1986) have to do with the "momentum" of your life; your cycles, life's path, and personal growth.
These include your Life Path, your Pinnacle and Period cycles, your Birth Day number, Rational Thought, and Challenges.
The Hidden Passion and Karmic Lessons are based on the letters in your name, and is one of the most revealing aspects.
The Planes of Expression is also based on the letters in your name; the letters in the alphabet are divided in four groups: Physical, Mental, Emotional, and Intuitive. This part shows to what extent you have been given these attributes.

The three piewheels (only one is shown here) represent the Essence cycles and the Personal Months. The wave below it shows vertical columns stacked to include Transits, the Essence, the Period cycles, and the Pinnacle cycles, as well as the person's age, and the calendar year.
The Subconscious Self is shown inside the "arch", while the Cornerstone, Capstone, and Key make up the triangle.

The Diamond Spirit reading is based on the first nine letters of your name and shows to what extent your experiences on the physical and material plane affect your spiritual growth, and vice versa. The Diamond is used by few numerologists and is thought to be an Arabian off-shoot of the Pythagorean system.

-Ω-
We need to prioritize the relative values of each number and its position - which tells you where and how that number will affect you. This is the hardest part of learning numerology and is really learned only through experience.
The Life Path number is by far the most important number and represents a cycle. The longest cycle of your life, it runs from birth to death. Perhaps the most important concept to recognize, and probably the least understood, is that all the numbers based on your date of birth reflect something about the "momentum" of your life. The flow, the current which carries you forward, the stream of life.
Therefore, every number derived from your date of birth tells something about the direction of your life, the path you walk on, and the opportunities and challenges you encounter.
Next, read the Birth Day number. In order of importance, the Birth Day number belongs in fifth or sixth place, but it is closely related to the Life Path, and should be seen in connection to it.
Follow with your name, where the Expression number, which reveals your talents, abilities, and goals, is particularly important in relation to career.
Then read the Heart's Desire, and understand it as the motivator behind virtually all of your choices, in particular those related to life style and environment. Also, look at the Minor Expression and Minor Heart's Desire as contributing influences to your overall ambitions and personality.
The Personality number completes this picture of the core numbers. Remember, while the Personality number is the last of the core numbers, it is the first impression people will get.
The Personality number is usually what gets you hired, while the Expression number is the greatest influence on how well you perform. The Heart's Desire number influences the type of conditions you like to work under; alone or with people; in a small non-profit organization, or in a big corporation; in the inner-city or in the country. The Heart's Desire also strongly influences your choice of career.
The core numbers outline the basic personality. The rest reflects a closer look at you - your many nuances, individual character traits, and strengths and weaknesses.
-Ω-
Some numerologists, including myself, often prefer to start a reading with the name instead of the date of birth (the core name numbers, instead of the Life Path and Birthday numbers). The reason is that the name is static - it tells us who you are, and while this part of you evolves over the course of your life, it essentially stays the same, while your birth date numbers change, and more importantly, change you, and are therefore more dynamic.
-Ω-
The Challenges follow, and are, in my opinion, among the most important sources of information. Challenges, more than any other number, point to aspects of your personality that you have to work on. They represent the first and most obvious obstacles that stand between you and success.
Follow with the Maturity number, but keep in mind that it does not enter a person's life until after the early thirties, after which its influence grows more important with age. The Maturity number is a kind of secondary Life Path number. It adds specific challenges, as well as abilities, to your life.
Next, read the Karmic Lessons, which reveal weaknesses or undeveloped areas. Follow with the Hidden Passion, which reveals what you are good at, and what you love to do. Then move on to the Subconscious Self, which shows how confident and secure you are in the use of your talents and abilities.
The Balance number stands somewhat apart, but is very revealing, particularly when you are off-balance as a result of emotional turmoil. The Balance number reveals your strengths in turbulent times. The remainder is made up of the Bridge Numbers, Cornerstone, Capstone, First Vowel, Rational Thought number, and Planes of Expression. Each of these areas is well defined and easily identifiable as to the role it plays in your life. Each represents subtle, but important aspects of your personality.
-Ω-